Getting started
Dependencies
In order to run IsobaricQuant Java 17 is needed, first of all make sure you don’t have the correct version installed already with the following command:
java --version
If you don’t have Java 17 installed follow the official instructions on how to install Java 17 for your platform:
Microsoft Windows
Installation of the JDK on Microsoft Windows Platforms: Instructions include steps to install the JDK on 64-bit Microsoft Windows operating systems.
Linux
Installation of the JDK on Linux Platforms: Instructions include installation from Archive files and Red Hat Package Manager (RPM).
macOS
Installation of the JDK on macOS: Instructions include steps to install the JDK on the macOS platform.
Installation
Since IsobaricQuant is a java application, its installation is straightforward, first you need to download the jar file for your platform:
Once the jar file is downloaded, place it in a folder of your choice, open a terminal and navigate to the jar file location. That’s it!
How to run IsobaricQuant?
After downloading the jar file, IsobaricQuant can be used via GUI:
java --add-opens java.base/java.lang=ALL-UNNAMED -jar IsobaricQuant.jar
Or it can be used via command line:
java -jar IsobaricQuant.jar -c <config_file> -mzf <mz_file> -h <hits_file> -o <output_folder>
IsobaricQuant CLI mode
java -jar IsobaricQuant.jar -c <config_file> -mzf <mz_file> -h <hits_file> -o <output_folder>
The CLI mode doesn’t include a viewer, as soon as the command is executed the quantification starts, once is completed an output folder is generated with all the output files detailed in the previous section. The generated files can be opened using the GUI version at any time. The CLI version will allow the user to include IsobaricQuant in any pipeline
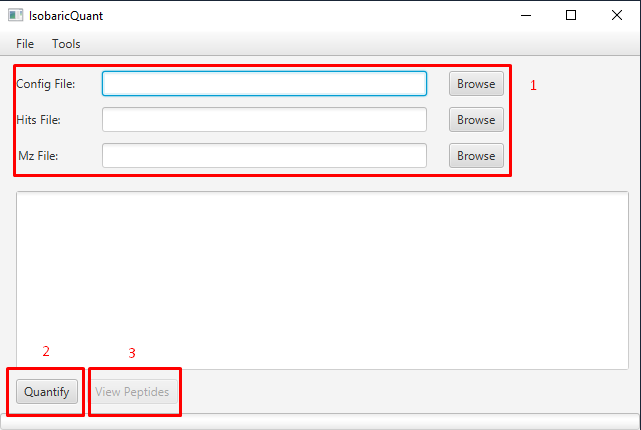
IsobaricQuant GUI mode
On the GUI mode you will find a window with some options:
Select the input files, for more information about input files refer to the
Input/Output FilessectionOnce all the files have been selected preceed with the quantification using the Quantify button
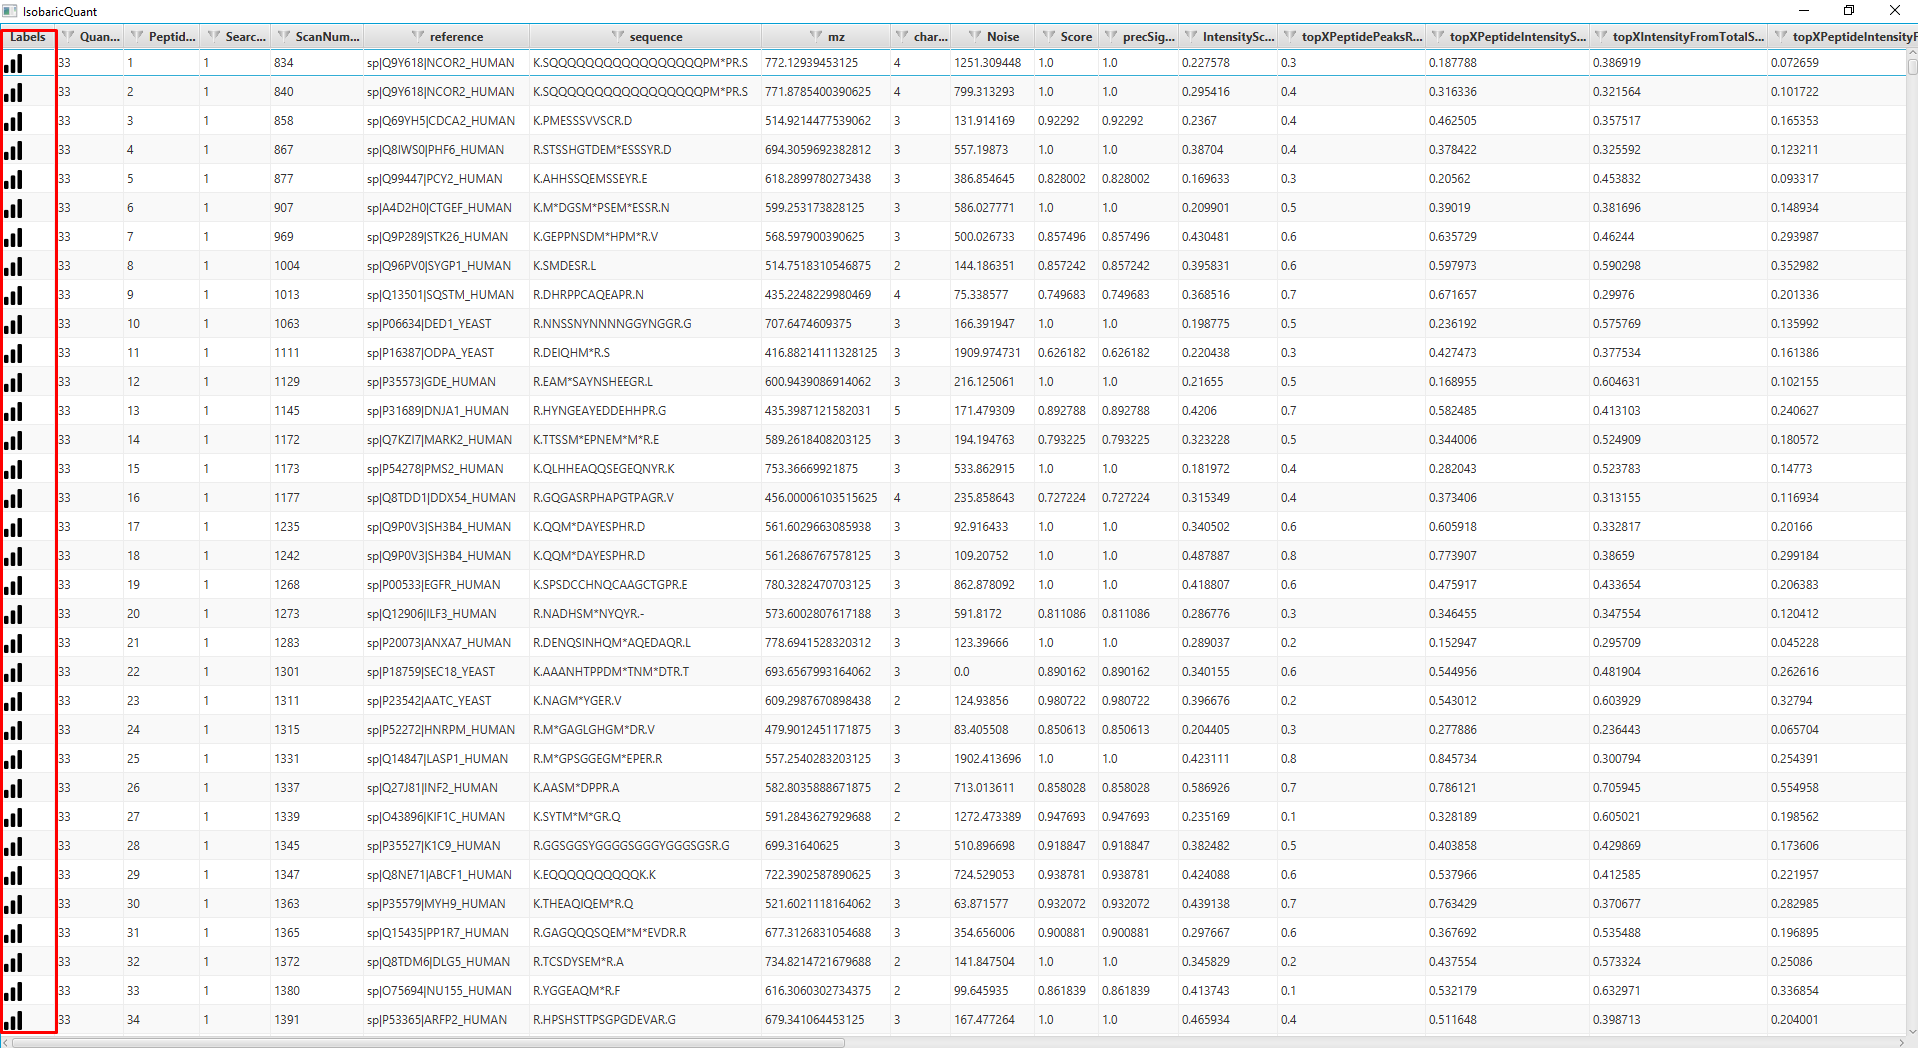
When the quantification is completed you can proceed to consult the peptide information
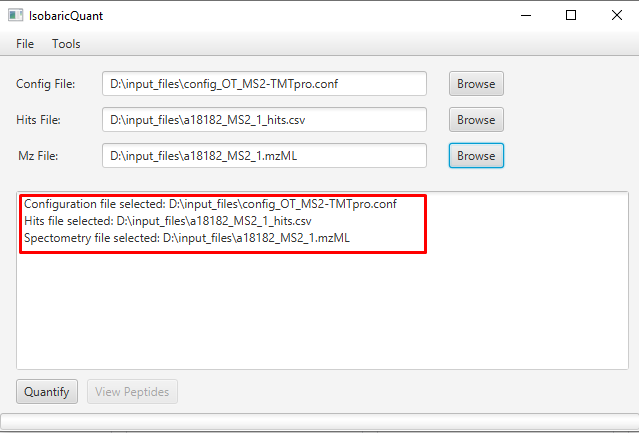
In the log window you can check if the path of the selected files is correct:
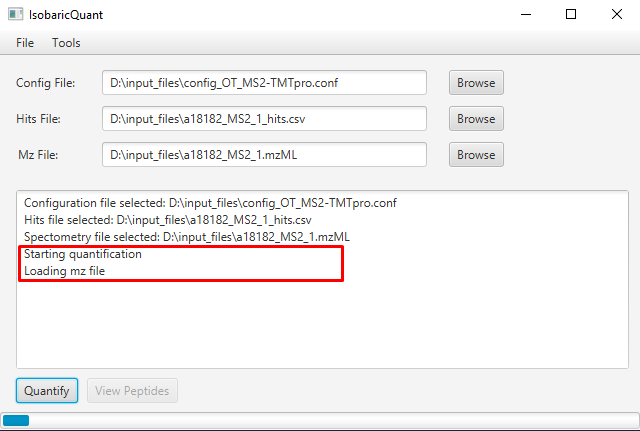
Once you click the Quantify button, the quantification will start, indicating the steps involved on the process:
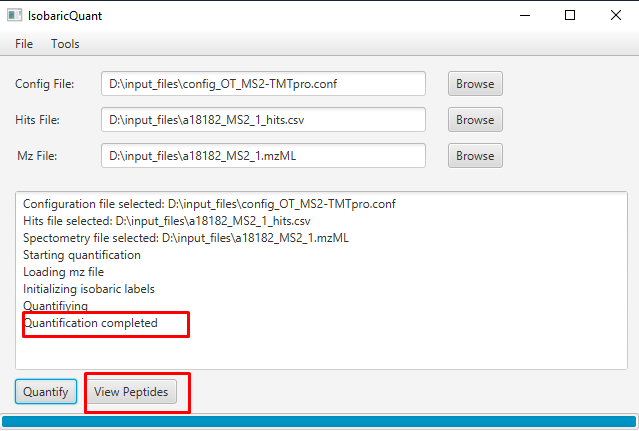
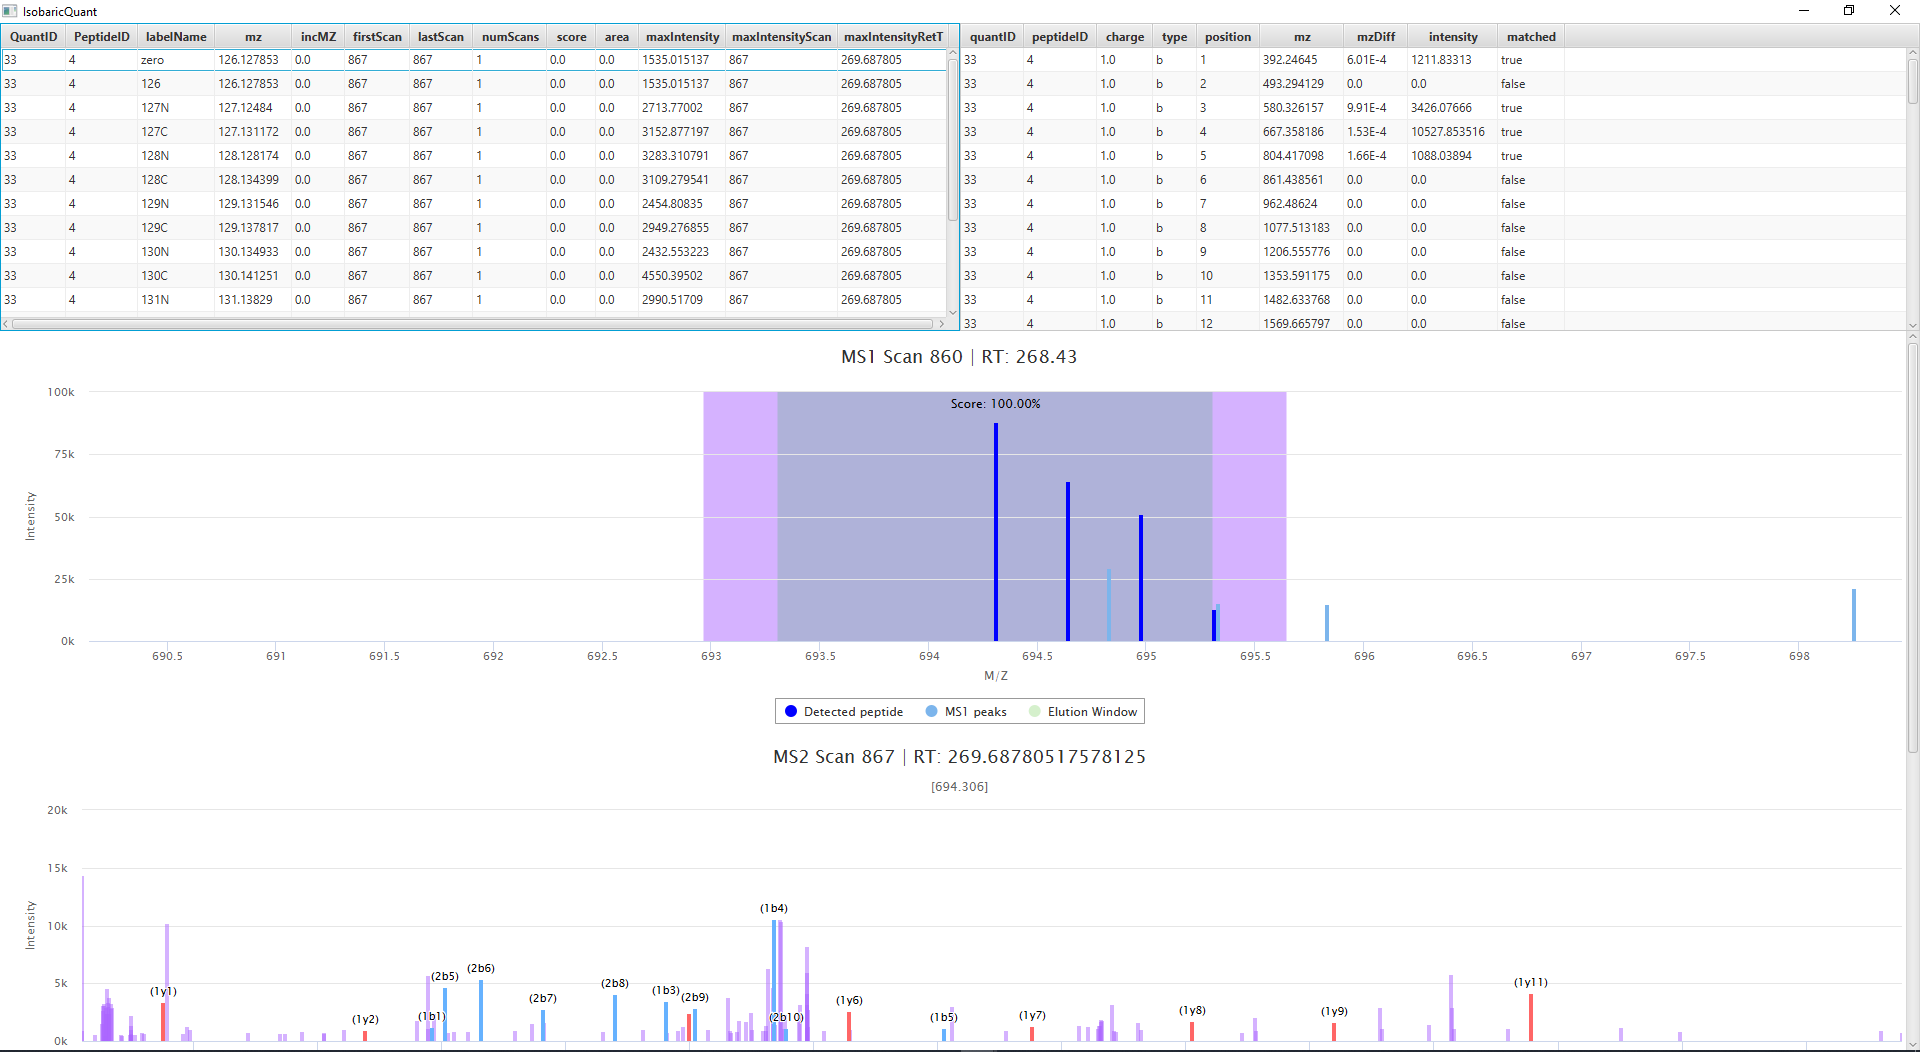
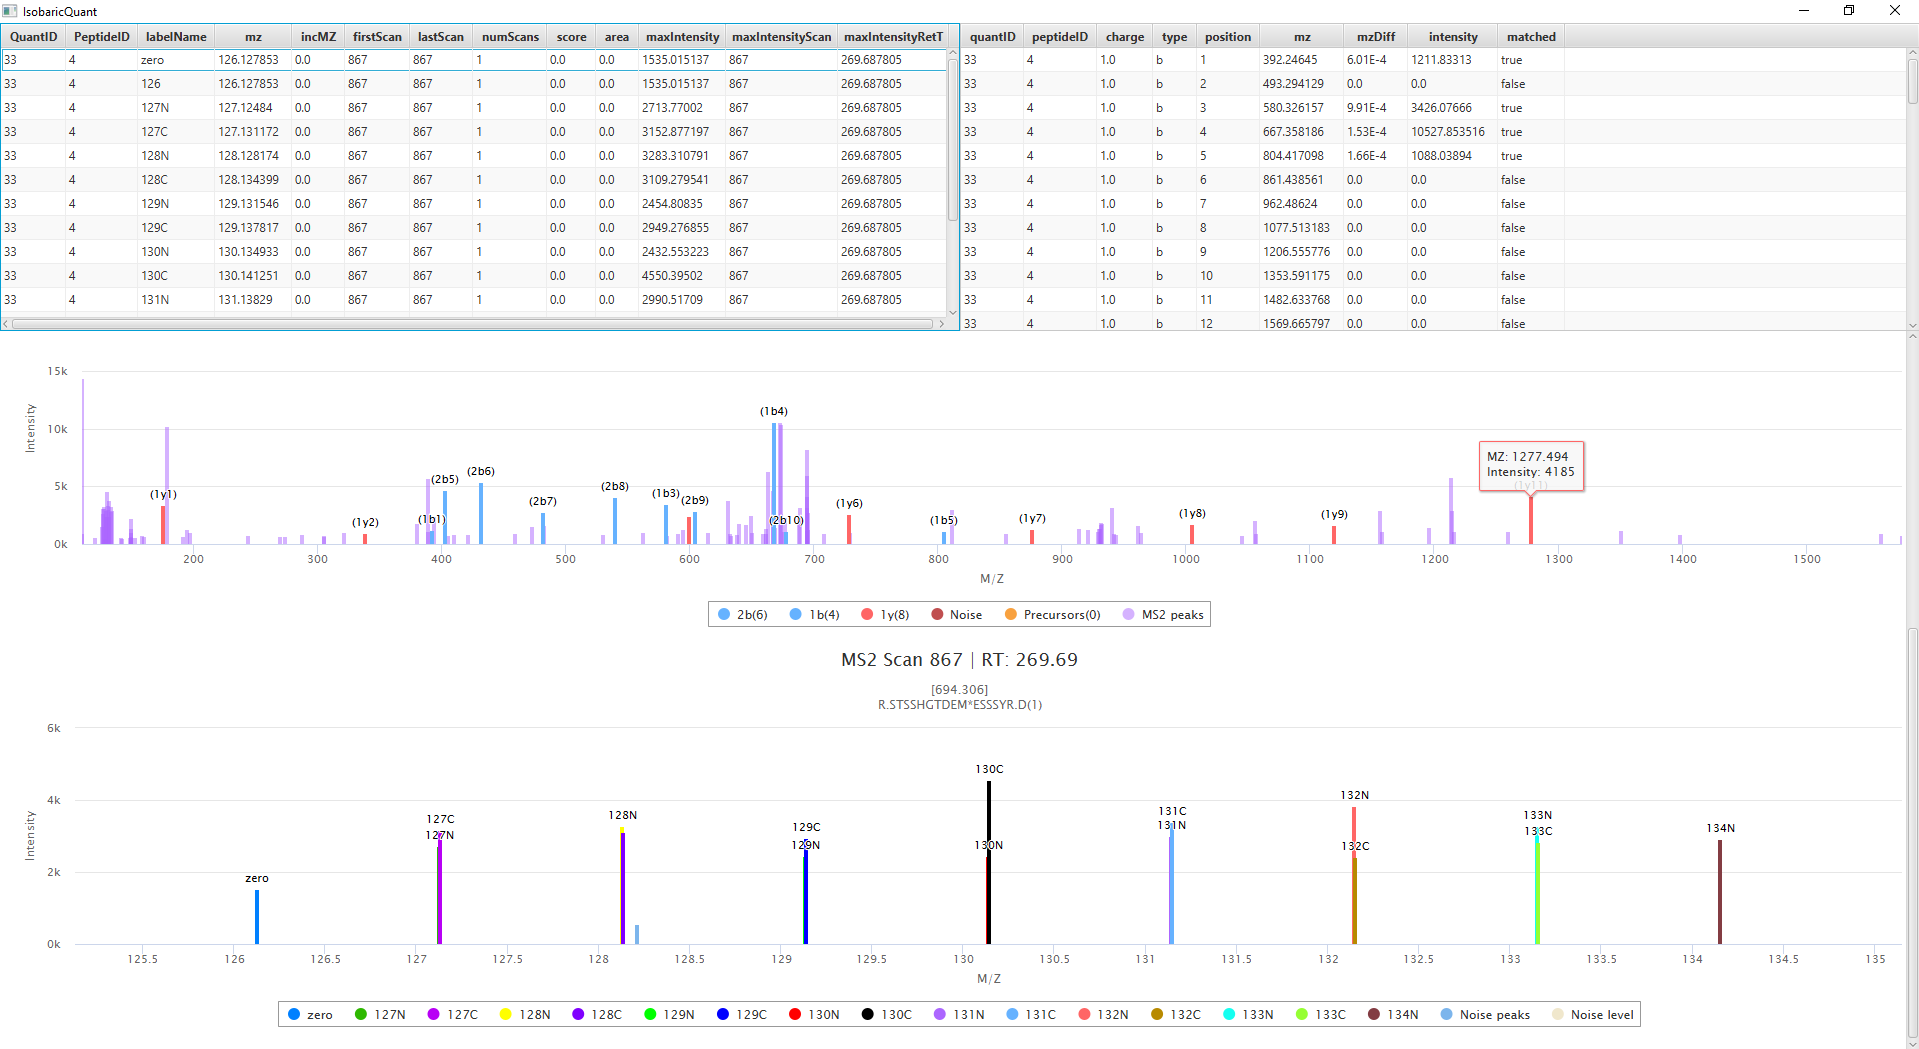
When the quantification is done, an output folder is created with the quantification information. The GUI includes a viewer, that will allow the user to view the quantification matching information including fragment ions
Input Files
Configuration file
{
    "generateFragmentIonsFile": true,
    "ms2NoiseWindowTolerance": 1,
    "searchFragmentWIndowTolerance": 1.5,
    "isoMethod": "TMTpro",
    "confLabels": "all",
    "PPMTolerance": 20,
    "MS1PPMTolerance": 20,
    "MS2PPMTolerance": 20,
    "massType": "HCD_FRAGMENTATION",
    "scanLevel": 2,
    "scoreType": "ISOTOPE_DISTRIBUTION",
    "ms1PrecWindowDaltons": 0.35,
    "neutralLossesFI": "63.98,18.01,17.03",
    "neutralLosses": "63.98,18.01,17.03",
    "topXNum": 10,
    "ms1DepthSearch": 5,
    "recalcIntensities": false,
    "dataSheetName": "TMT11_TL277832",
    "modifications": {
        "varMods": "15.9949146202 M 42.01056468472 n",
        "consMods": "pep_n 304.2071453165, C 57.02146372118, K 304.2071453165",
        "varTermParams": ""
    },
    "mzFilePath": "",
    "hitImpurity": "master_scan",
    "searchMethod": "most_intense"
}
Parameter description
precursor int / intensities in isolation window (calculated using
ms1PrecWindowDaltons)signalPerc = precIntensity / allIntensities
if it’s weighted, then it will calculate the same thing as the above but for the current ms1, its previous ms1 and its posterior ms1. The result is the weighted signal, calculated using the RT distance to the current ms1
(dPivotCurrent / totalDistances) * currentSignal + (dPivotPre / totalDistances) * preSignal + (dPivotPost / totalDistances) * postSignal
Default: master_scan
Mz File
mzML or mzXML input file. The instrument raw file can be converted from existing tools such as msconvert.
Hits file
Comma separated values of the identified peptides. A conversion of the output file of a search algorithm such as Comet is required.
The values are the following:
Output Files
Once IsobaricQuant finishes the quantification an output folder will be created on the same folder where the IsobaricQuant jar file resides.
The output folder contains 4 csv files with the result of the quantification
isofrag.csv
File containing matching information for the peptide’s fragment ions
isolab.csv
File containing the quantification data
isopep.csv
File containing the basic information to be used to match the results with the other files
isopep_extra.csv
File containing the quantification scores. Please, check the scores description for further information.
Test files
Once IsobaricQuant is ready to run, you can use the following input and output sample files to test the jar and its dependencies are working properly